GEODETIC WORKS FOR THE SLOVAK GAS INDUSTRYJan HARDOS, SlovakiaKey words: surveying the lines and objects of transition system, setting-out and surveying the pipeline defects, measurement of displacement and settlement, mapping of local distribution networks. 1. INTRODUCTIONThe Slovak Gas Industry (further SGI) is a natural state monopoly enterprise in the field of gas industry in Slovakia. It deals with purchase, transit, distribution and sale of natural gas. It buys the natural gas from Russia and assures its transit across the Slovak territory to Czech Republic, Austria, Croatia, Slovenia, Italy, Germany and France. The SGI is the second biggest gas transporter in the world. The length of transit pipeline system makes 2 260 km in 4 - 5 lines (pipelines with diameter of 900 - 1400 mm). The SGI is transporting 88 milliard m3 natural gas through its transit system per year, whereas the domestic consumption represents about 7 milliard m3. The distribution long-distance pipelines measure approximately 5 880 km and the local distribution network is about19 660 km long. Together with the transit system it represents about 27 800 km gas pipelines installed on the Slovak territory. About 1800 villages and towns from the total number of 2878 are connected to the gas distribution network, what means that about 81% population of Slovakia has access to natural gas. This huge system of underground pipelines, surface technological objects (compressor stations, distribution nodes, transfer stations, regulation stations etc.) including the operational and administrative objects necessary for the purposes of design, construction, service, maintenance and evidence of its equipment have always utilised the geodetic activities. Naturally, in the past that concerned mostly the analogue outputs of geodetic works (paper maps) but since 1990 a gradual switch to digital mapping technologies can be observed, which have enabled to utilise the geodetic data actively via the modern information technologies. The geodetic digital data connected to the state co-ordinates system and to the state elevation system are of extreme importance not only for the gas specialists but also for the administrators of engineering networks, since a vast majority of property administered by them (pipelines, cables etc.) is situated under the ground and is invisible by naked eye. In this respect, the geodetic activities, being performed in digital form, enable not only to utilise the localized information in a more rational way, but they mainly allow to eliminate or at least to reduce considerably the collisions with other administrators of underground networks or other users of the territory (design and construction of roads, railroads, buildings etc.). That aspect then simultaneously increases the safety of surrounding land from the economic and ecological viewpoint. In my contribution I will try to outline briefly the main geodetic activities performed for the transit system and also for the distribution network of the SGI. 2. SURVEYING THE LINES OF TRANSITION SYSTEMSince the start of construction of the lines of the transition gas pipeline roughly in 70-ties of the past century, the individual lines were geodetically surveyed in state positional co-ordinate system JTSK (unified cadastre trigonometric network) and in the state level system Bpv (the so-called Balt after adjustment). The pipelines were surveyed partially in an open trench, but regarding the conditions of construction site (fast burring of pipeline in the trench) they were in most cases surveyed only after pipeline burial, i.e. the pipeline axis was found by electromagnetic locators followed with measurement at each about 100 m in the straight line or more frequently in the curves. The surface equipment of gas pipeline (orientation poles, connecting objects and outputs of cathodic protection) and other underground equipment related to the pipeline (anode victims, connecting cables, long-distance telemetric metallic cables, crossing foreign engineering networks seen in the trench etc.) was measured additionally. The results of surveying were plotted in analogue manner to the state maps in 1 : 5000 scale, containing also the lists of co-ordinates of the surveyed points. For the purposes of better manipulation and archiving, the analogue maps and co-ordinate lists were photographed on micro pictures. Approximately since 1990, the digital mapping and processing is employed. The analogue documentation of the line section was gradually transferred to the CAD system MicroStation by the transfer from co-ordinates or by digitalisation, in case when the co-ordinates have not been preserved. A permanently stabilised position and elevation point field was built along the pipeline with density about 500 m, to allow its utilisation for additional surveying, updating and maintenance of the lines. Mapping then continued with a direct output to the CAD system MicroStation by an additional surveying of all crossing subjects, which passed or approached the pipeline axis within its protective zone and which were not surveyed in the past during analogue mapping due to the fact that the scale of the analogue map did not permit to represent the details. In this way, all crossing communications, water streams, railroads, above-ground conducts were surveyed for position and elevation and also all foreign crossings of underground lines were added by searching with electromagnetic locators, thus also those that were not seen in the past, during the construction. The MicroStation system and digital data have enabled their continual updating, mainly as the foreign crossing lines are concerned, first of all by employing the design co-ordinates of the foreign network and in the second stage also by correcting the position and elevation from the geodetic survey prior to burring in the trench. Since 1993 the administrator of the lines of transition pipeline started to utilise also the geodetic data also in the form of a simple GIS on the basis of MicroStation and MDL applications. The directly surveyed geodetic data were gradually supplemented also by other digital information as for example:
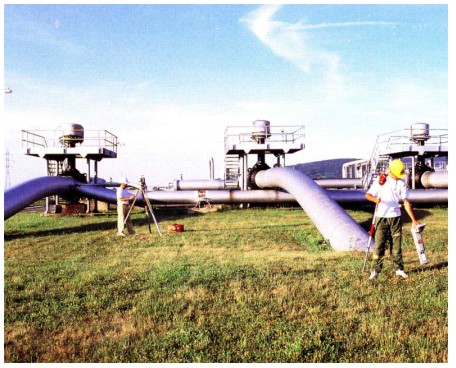
That endeavour resulted on the end of 90-ties in an object-oriented GIS, based upon the Intergraph (MGE, Geomedia) and ORACLE. 3. SURVEYING THE TECHNOLOGICAL OBJECTSA part of geodetic works was also the mapping of technological objects of the gas pipeline, as for example the compressor stations, distribution nodes (Fig.1), transfer stations, line closures etc.
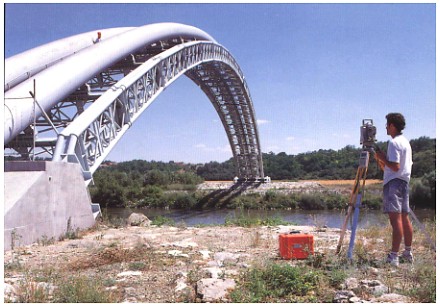
Fig.1: Measurement of technological objects These objects are characterised with a high density of technological equipment. Due that reason, the mapping also had a specific character. Mapping was performed by a digital output to the MicroStation system with subsequent printing of analogue maps in 1:200 scale. The position and elevation surveying of all above-ground and underground pipelines was performed in JTSK and Bpv state co-ordinate and level systems and were represented not by their axis but by their actual diameter. All visible equipment (valves, spherical valves, check outlets, flanges, pressure gauges etc.) were surveyed as well as all above-ground and underground telemetric and power cables,and other common objects of measurement (communications, buildings, fences etc.). All pieces of equipment were supplemented by the description (number and type of equipment, kind and type of cable etc.). Also the object surroundings were measured up to the closest public approach route. The resultant digital geodetic data (maps) were included into GIS as well. 4. GEODETIC WORKS AT THE ANTICORROSION INSPECTION OF PIPELINESSince all material is aged and deteriorated with the age and external effects, the internal inspection of pipelines by use of the so-called intelligent pig is an important part of the maintenance and reconstruction works. The pig is an electronic device of cylindrical shape, loaded into the pipeline though an entry chamber in the compressor station or the object of distribution node and is carried by the gas pressure in the pipeline over the distance of several tens kilometres up to the nearest object with an exit chamber. This equipment continually registers the passed distance and all inhomogeneities of the pipeline as welds, corrosion, flanges, screens, outlets, spherical valves, bends etc. These data serve for the repair or replacement of the corroded or weakened parts of the pipeline. All 4 lines of the transit systems with pipeline diameter from 900 to 1400 mm in overall length 2260 km were inspected in that way. The passed distance is then checked from outside by the so-called markers located on the surface above the pipeline axis, what are in principle the timed devices which are magnetically switched off after the pig passage under the pipeline. The pig at the same time registers the marker stationing. The distance passed in the pipeline is then corrected by the registered time of pig passage, known spatial distance between the markers and the known velocity of pig movement. Each registered inhomogeneity in the pipeline can be thus exactly positioned (as the distance from the initial point of inspection stage). 4.1 Setting-out the pipeline defectsThe main problem is that the accuracy of distance measured by the pig is much lower that the possibilities of geodetic methods. The pig does not move at a constant speed, since its velocity is besides the gas pressure affected also by a rapid up- or down-slope of the pipeline or by a local friction change in the pipeline etc. Thus, at the passed distance of 10 km the error of pig can make several tens metres but at the distance about 40 km this error may attain hundreds metres. Finding the defect location on the pipeline surface would thus be very inaccurate and would cause additional time and repair cost losses. Therefore the markers were located on each 1.5 - 2 km above the pipeline, surveyed geodetically and the exact space distance between the markers along the pipeline was calculated and in this way, the error in defect location on the pipeline was minimised. In spite of reduced distance, the difference between the exact length of geodetically determined curve and the length of curve determined by the pig was from several cm to several metres. This problem of pig inaccuracy would be eliminated, if all welds on the pipeline would be geodetically surveyed always prior to its burial during its construction in the past (the welds could serve as the natural markers with exactly known co-ordinates). 4.2 Surveying the pipeline defectsAfter the setting-out, uncovering the pipeline and repair of the found defect, the repaired point on the pipeline, new welds or old visible ones that were not registered during the construction are measured for the position and elevation above sea-level. The output of such surveying is a graphical file in MicroStation system with a protocol and the list of co-ordinates and elevations of the elements surveyed on the pipeline. The pipeline administrator then includes the new and corrected data into the GIS. In this way, also the old data on the pipeline position and elevation that were in the past measured by surface location with the aid of electromagnetic locators (with pipeline depth also detected with the aid of those locators) have been corrected. 5. TECHNICAL AND SAFETY MEASUREMENTS ON A TRANSIT SYSTEMThe transit gas pipeline system represents a certain potential risk for its surrounding owing to very high gas pressures and therefore some of its elements must be subjected to a regular safety monitoring. This, besides the other aspects, involves a special geodetic measurement of spatial stability of some technological equipment situated on the surface. A significant static damage of the equipment may result in the breakdown with catastrophic consequences on ecological safety of the surroundings and may also cause considerable losses due to interruption of gas transfer. Such equipment is for example the air passages of large-diameter pipelines over the waterways (Fig.2) and compressor stations.
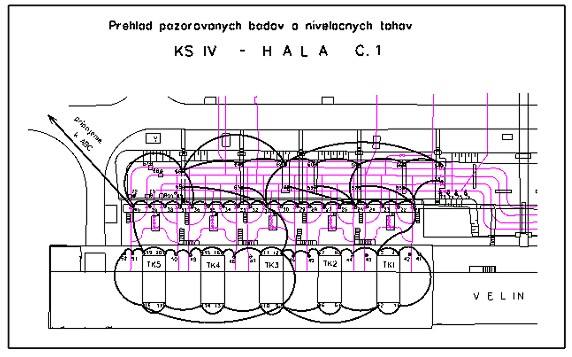
Fig.2: Air passage of pipeline over the river 5.1 Measurement of displacement on the passages over the waterwaysAt construction of older lines of the transit gas pipeline, the passages of pipelines over greater waterways were solved via air passages with a supporting bridge structure (Fig.2) or sometimes - at smaller width - also without any support structure. The up and down displacement of pipeline, as the result of thermal expansivity does not represent such a danger as the transverse or longitudinal displacements of the concrete, the so-called braking blocks, which may impair the strength of pipeline welds. By the specialists, the waterways in general pose a certain risk of reciprocal displacement of their banks at the seismic activities (seismic shear). The newer pipelines have been solved by the inverted siphon under the river beds. For the purposes of monitoring the displacements of concrete braking blocks, support bridge structure and the pipeline itself, a permanently stabilised local network of 6 reference points (with 3 points on each side of the pipeline) have been built on the protective dams of the river in proximity of each air passage. These points are positionally determined with the accuracy below 1 mm (by a precise multiplied angular and lenght measurement with a depended centering using precise total stations) with subsequent adjustment. Since the displacement of these points cannot be totally excluded, the network is always assessed as a dynamic one, with stability assessment of individual network points based upon the mathematical and statistical methods. Regarding the elevation, the network is again determined at each measurement stage by a very precise levelling from the distant levelling points with the accuracy up to 0.5 mm. After stability measurement of the reference points, the permanently stabilised points on the pipeline, support bridge structure and concrete braking blocks are measured by the method of spatial intersection from the horizontal and elevation angles. In this manner 20-28 points are surveyed on each air passage from two combinations for the horizontal angles and from 3 combinations for the elevation angles. Regarding the fact that the length of sight lines ranges from 50 - 100 m, the mean error of determination of X, Y, Z co-ordinates does not exceed 1 - 2 mm. The result of measurement is the table of spatial displacements of observed points with an appropriate graphical representation of the displacements in vertical, longitudinal and transverse directions related to the pipeline. 5.2 Measurement of settlement of turbocompressorsThe compressor stations of transit gas pipeline assure the necessary gas pressure in a transit system for the purposes of gas transfer in the 4-5 lines for long distances. Four compressor stations on Slovak territory are spaced by about 100 km from each other. They represent an extensive and complex technological system with automated processes. 21 to 23 turbo machines (gas turbines with single stage compressors) with the installed power of 6 MW for each turbine were employed. The stability of foundations of the individual technological components, which are mutually interconnected by a network of large-diameter pipelines under very high pressure (up to 7 MPa) is extremely essential from the viewpoint of safety and service continuance. It is important that the individual foundations should not decline or settle unequally, what might impair the turbine running or the strength of welds in the pipeline. For the mentioned reasons, the elevation settlement of the foundations of turbocompressors, outlet spherical valves and the concrete foundations of pipeline supports is regularly monitored geodetically twice in a year. Up to 300 check point marks in five halls are stabilised in one compressor station (1 hall for 1 line with about 60 check point - Fig.3). These points are measured by a system of levelling traverses by the method of precise levelling with the mean error below 0.25 mm. To assure this accuracy at very unfavourable conditions for measurement (great thermal difference inside and outside the halls, high noise level - attaining 100 dB, vibrations), the system of levelling traverses is adjusted at each measurement stage by the least squares method - conditional adjustment. For a long period of measurements, the irregularity of settlement between the technologically related foundations did not exceed the value in order of 3 mm.
Fig.3: Schema of levelling traverses in Hall 1 on Compressor station IV
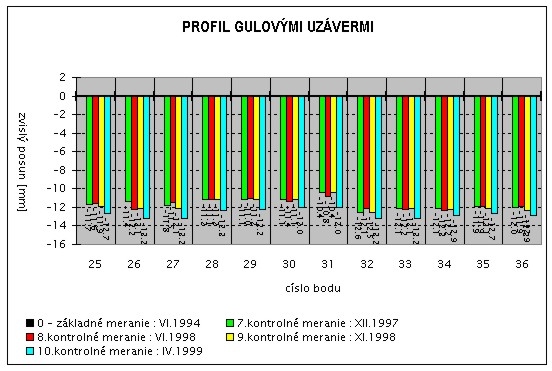
Fig.4: Graph of settlement of spherical valves 6. GEODETIC WORKS FOR THE LOCAL DISTRIBUTION NETWORKSMajority of geodetic works is being performed for the local distribution networks in the villages and town, i. e. from the regulation stations of natural gas on the village borders thorough the main distribution systems in the village up to the individual connections to the houses (users) terminated with the main house closing valves. Approximately since 1990 the geodetic surveying of the local networks was processed first on the Autocad CAD system, later jointly on the MicroStation system, based upon the SGI guidelines. „Creation and processing of the geodetic and digital map documentation of local networks„. These guidelines assure a unified geodetic surveying and processing of the local gas pipeline networks on the territory of whole Slovak republic. The guidelines specify a unified way of digital processing of map contents with an exact structure and content of individual reference files of the MicroStation system. That enables the administrators to facilitate an easier data transfer to GIS SGI. The mapping is done in a unique 1:500 scale in the JTSK state positional system and in the Bpv state elevation system. The local networks are mostly surveyed during the construction of new networks, but also the existing old networks, which were not mapped digitally in the past are added gradually. The geodetic works for the new-built local networks can be divided into two main time stages: In the 1.stage, the planimetric component of a map and altimetry of the surroundings of the future gas pipeline are surveyed (unless there exists a previously surveyed suitable digital document) - the so-called street bands, namely the street in its whole width up to the front line of the buildings or in an approximate band width of 30 m. All common objects are also surveyed (houses, fences, communications, trees, lamp posts, bridges, ditches, slopes, external signs of all underground engineering networks, routes of all conducts above the ground etc.). The digital planimetric component of a map and altimetry surveyed in such a way are then provided to designers to design (to project) the local gas pipeline network. In the 2. stage, after start of construction the surveyor surveys all new-built gas pipelines (steel or plastic ones) in an open trench. Surveyed are also all points of deviation of the line (horizontal and vertical deviations) on the gas pipelines, at straight sections in max distance up to 40 m, points of change in diameter and material of the pipeline, points of branch attachment, main closing valves of house connections, other devices of gas pipelines as the drain valves, air release valves, by-passes with their accessories, all foreign engineering networks crossing the pipeline route in the trench, interconnecting objects, stations of cathodic protection with their devices, orientation poles etc.- (Fig. 7). In the recent years also topology of measured elements (line, point, area) has been maintained with their links, to facilitate the loading of measured data into an object-oriented GIS. The geodetic works performed for the old existing local networks are actually the same as those done for the new-built networks with the only difference that the measurement of street bands is joined to one time stage together with surveying the pipelines which are, however, set out by the electromagnetic locators either by the employees of gas enterprise or directly by the surveyors, as long as they master that operation and have the appropriate equipment. Typical feature of digital maps for the local gas pipelines is, that all deviation points of underground gas distribution are in the final stage computer dimensioned from the nearest visible measurement subjects (houses, fences, poles, shafts etc.). These dimensions serve for the maintenance specialists of the gas pipeline to locate easier the gas pipeline networks in the terrain, since for the site purposes these specialists are using the analogue (paper) prints of digital maps. A part of geodetic works for the distribution gas pipeline networks is naturally also the surveying of long-distance, high-pressure pipelines of different levels, from tapping on the transit system or on underground storage tanks to the connection gas pipelines between the villages, surveying the regulation stations, other gas objects etc. 7. CONCLUSIONSThe Slovak Gas Industry belongs to the greatest contractors of geodetic works in Slovakia, together with the telecommunications, owing to great boom in gas introduction for the past 10 - 15 years. A great number of smaller and bigger private geodetic companies have participated in all those works. At present, such works are on decline with respect to gradual completion of gas introduction process on a large part of the territory of Slovakia. It may be finally concluded, that these works done for the SGI have brought about a considerable merit, owing to a rapid technological modernisation and development of the Slovak geodetic companies, which are today employing the most advanced measuring, computing and image processing technology, starting with the total stations and GPS to AutoCad 2000, MicroStation under the Windows NT, Geomedia etc. BIOGRAPHICAL NOTEJan Hardos Education: (1970-1975) Slovak Technical University in Bratislava, Faculty of Civil Engineering, specialisation: geodesy and cartography. He attained the certificate of authorised surveyor for engineering geodesy in 1980 and for cadastre in 1992. Professional experience: Since 1975 he performed and managed the surveying works mainly in engineering geodesy (investment construction, deformation measurement, mapping operations). In years 1985 - 1989 he acted as a Czechoslovak expert for the Ministry of Water Economy of Algeria at geodetic assurance of construction of 4 dams in North-East Algeria. Since 1993 he is the Director and joint owner of a private geodetic company SIGEO Ltd Bratislava. Membership in professional organisations: (1990-1995) the member of chair of Slovak Union of Surveyors, since 1996 a member of the Directive Board of Chamber of Surveyors and Cartographers. Vice-president of Slovak National Committee for FIG and national delegate for the 6. Commission of FIG since 1998, national delegate for CLGE (Council of European Geodetic Surveyors) since 1999. CONTACTDipl.Ing. Jan Hardos 15 April 2001 This page is maintained by the FIG Office. Last revised on 15-03-16. |