Article of the Month - June 2025
|
Determination of GNSS RTK accuracy in various
environments
Paul Denys, Yuxi Jin, Jett Gannaway, Hamish Gibson,
New Zealand
 |
 |
 |
 |
| Paul Denys |
Yuxi Jin |
Jett Gannaway |
Hamish Gibson |
This article in .pdf-format
(15 pages)
SUMMARY
Real-Time Kinematic (RTK) is a well-established and versatile Global
Navigation Satellite Systems (GNSS) technique widely used in the
surveying and geospatial industries. Users are generally aware of GNSS
measurement errors caused by satellite geometry, signal transmission,
and the local environment, as well as the methods used to mitigate these
errors. Most errors are minimized using robust mathematical algorithms,
such as double differencing and On-the-Fly techniques, along with
appropriate models to account for factors like antenna phase centre and
tropospheric delay. However, errors caused by the local environment,
such as signal multipath and obstructions from man-made structures or
vegetation, remain challenging to address.
This study investigates how reduced signal availability (satellite
geometry) in challenging environments affects RTK coordinate accuracy.
It quantifies these errors in areas with poor sky visibility and
examines the impact of using different satellite constellations,
including GPS+Galileo+BDS (GEC), GPS+BDS (GE), and GPS-only (G)
configurations.
INTRODUCTION
Modern GNSS technology has significantly expanded the possibilities
for positioning and geospatial application, but it also allows users to
push the boundaries. Many users have shared experiences of using RTK
technology in challenging environments. However, just because the
technology can determine a position and display plausible Quality
Control (QC) metrics does not guarantee that the computed position is
accurate or reliable. While favourable precision statistics often
suggest repeatable results, they may still include significant biases
caused by signal multipath or reduced satellite availability due to
topographical obstructions or vegetation
For example, positioning errors can occur when an antenna is placed
under a protruding veranda, thereby restricting access to GNSS signals
and increasing the potential for multipath effects (Figure 1a).
Similarly, thick vegetation can interfere with the GNSS signals,
reducing positioning accuracy (Figure 1b).

Figure 1: Examples of challenging satellite positioning environments:
(a) in the vicinity of buildings including an overhanging veranda
(staged), and (b) thick vegetation that interferes with the transmission
of the GNSS signal.
Feedback from surveying professionals, including those who hire
graduates from the University of Otago’s surveying program, highlights
another issue: some graduates may place too much trust in GNSS RTK
positioning accuracy. They are too accepting of the accuracy and
reliability of the technology. This concern is troubling, especially
since the Otago surveying program neither teaches nor endorses such
practices. However, these issues are likely to be not limited to recent
graduates and warrants broader attention.
2. SURVEY DESIGN AND DATA ACQUISITION
 |
A network of survey marks was
established within 100 m of a GNSS base station (OUSD) (Figure
2). The base station and two other marks, SD14 and SD15, are
located on the roof of a three-story building (approximately 12
m high) and have clear sky visibility with no obstructions above
15°. The positions of all the marks were determined using a
combination of total station measurements, GNSS static baseline
observations, and height differences measured through digital
levelling
The survey marks on the ground are subject to varying levels of
sky visibility obstruction. The amount of obstruction (masking)
increased progressively for the marks, REH, P1, P3, P5, and P7
as they approached the building and the tall trees on the
left-hand side (Figure 3) This progression is also evident in
the sky visibility plots shown in Figure 4.
The roof sites (OUSD, SD14, SD15) had no obstructions (0%
masking), while the ground reference site (REH) experienced
approximately 19% obstruction, mostly in the northwest quadrant
due to the building and trees. The obstructions progressively
increased for the other ground marks (P1, P3, P5, and P7) to
24%, 33%, 43%, and 52%, respectively. Initially, the
obstructions were primarily to the west, but they |
| Figure 3: RTK positioning
error network. The GNSS base station is on the roof of a
three-floor building. The survey marks OUSD, SD14 and SD15 have
no sky visibility masking while the survey marks at ground level
(REH, P1, P3, P5 and P7) all have some level of sky visibility
masking. |
 |
| Figure 2: Location of the
survey marks showing the increase in sky visibility masking
towards the building (background) and the tall trees on the LHS.
The building is approximately 18 m high. The marks REF/REH and
RES are the same mark. |

Figure 4: Sky visibility plots. The roof sites (OUSD, SD14, SD15) did
not have obstructions above 15° (and the instrument elevation mask was
set to 15°). The reference sites REF, REH and RES had masking above 15°
of 19%, while the pegs P1, P3 P5 and P7 had increasing masking of 24%,
23% 43% sand 52% masking.
gradually increased to the north and east. There were no significant
obstructions to the south, although satellite signals from this
direction were minimal due to the GNSS constellation configuration.
The marks were positioned using a combination of total station
measurements, digital leveling, and GNSS static baseline observations.
Each mark was occupied multiple times to create a network with a high
level of redundancy. Selected GNSS baselines were used to reliably
connect the roof sites (OUSD, SD14, SD15) to specific ground sites
(Figure 2). The least squares adjustment of the network resulted in
horizontal and vertical coordinate precisions of 1–2 mm at the 95%
confidence level.
2.1 Accuracy and precision metrics
Accuracy and precision metrics are widely used to describe the
variability of measurements. However, as noted by van Diggelen (1998,
2007), these metrics are often applied inconsistently in both the
scientific literature (Deakin and Kildea, 1999) and by GNSS receiver
manufacturers. Common positional accuracy measures, which account for
repeatability and bias, include root mean square error (rms) and
circular error probability (CEP). The rms metric calculates the average
squared error, while CEP represents the median horizontal error and is
less influenced by large outliers, making it a robust statistic. These
metrics can also be expressed at different confidence levels, such as
2drms, R95, R99, or extended to three dimensions (e.g., spherical error
probability, SEP).
Many of these metrics originate from military science on positioning
and ballistics, as detailed in foundational works by Greenwalt and
Shultz (1962), Taub and Thomas (1983), Chin (1987), and Deakin and
Kildea (1999). While it remains crucial to quantify accuracy and
precision in surveying applications, the growing prevalence of the
smartphone and personal navigation device markets has introduced
additional accuracy standards. For instance, the Japanese mobile phone
market uses a 98% confidence interval for its accuracy metrics (van
Diggelen, 2007).
Here, we define commonly used accuracy measures:
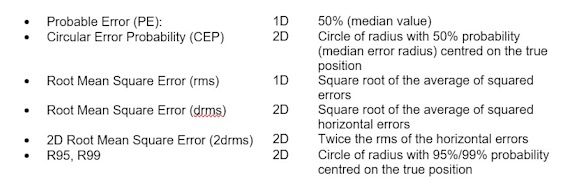
When calculating these metrics, certain assumptions are made:
- Positioning measurements follow a normal (Gaussian)
distribution.
- Horizontal positioning errors are approximately circular.
Although not strictly accurate, with multi-constellation systems and
near-complete satellite availability, position ellipticity is
minimal (van Diggelen, 2007). This simplifies the statistical
analysis
Table 1: Common vertical (1D) and horizontal (2D) accuracy measures
with their corresponding probabilities and scaling factors to convert
from the 1 sigma uncertainity.

It is straightforward to compute 1D precision measures (e.g., for
easting, northing, or vertical components). However, calculating metrics
for 2D (horizontal) or 3D positioning is more complex. For vertical
errors (1D), probabilities can be converted using the normal
distribution's scaling factors (Table 1). For horizontal positioning
(2D), the chi-squared (χ²) distribution is used to
combine two normally distributed variables (easting and northing), as
expressed by van Diggelen (2007):

In this study, we use 2drms, CEP, and 95% CI to compare horizontal
accuracy.
3. POSITIONAL PERFORMANCE OF TEST ENVIRONMENTS
Data was collected from the test sites using different satellite
constellations: GPS only (G) and a combination of GPGS and Galileo (GE)
and GPS, Galileo, and BDS (GEC). The test sites included two distinct
environments:
- Roof Sites: These sites had no significant
obstructions and zero masking.
- Ground Sites: These sites experienced
increasing levels of environmental obstructions, ranging from 19% to
52% masking.
The roof sites served as reference points where we expected optimal
positioning performance, with the highest accuracy and reliability. In
contrast, the ground sites were subject to environmental masking, which
was anticipated to affect performance due to three main factors:
- A reduction in the number of observable satellites.
- An increase in multipath errors.
- Higher measurement noise caused by vegetation interference e.g.
leaves.
These three sources of bias were expected to combine and result in
decreased overall positioning accuracy and reliability. However, this
study did not attempt to separate these biases individually.
3.1 Roof Sites – Zero satellite visibility masking
Two types of GNSS receivers, the Trimble R6 and R10, were tested on
the roof sites using the following satellite constellations: GPS only
(G), GPS + Galileo (GE), and GPS + Galileo + BDS (GEC). Positioning data
was collected at one-minute intervals over several days. The median
number of satellites observed increased from 8 for the Trimble R6 with
GPS only (G) to 21 for the Trimble R10 tracking three constellations
(GEC) (Table 2).
No statistically significant differences were found between the
GPS-only positioning results from either of the R6 and R10 receivers.
However, adding one or two constellations improved both vertical and
horizontal positioning accuracy. The vertical accuracy improved by
approximately 25%, from 12–13 mm to 9 mm (95% CI), while the horizontal
accuracy improved from 8 mm to 5–6 mm (95% CI) (Table 2).
The receivers also calculate formal vertical and horizontal
positioning errors, represented as a grey line in Figures 5 and 6.
Outlier positions, marked with red “+”
symbols, are those where the position error exceeded the receiver’s
formal 95% confidence interval. In practical fieldwork, this precision
metric is often used to assess the reliability of computed positions,
making it important to evaluate its validity.
A small percentage of the observations exceeded the formal 95%
confidence interval, although most vertical errors were negative (Table
2). Figures 5 and 6 show the time series for vertical positions and
horizontal plots for the R10 with GPS only (G) and with all
constellations (GEC), respectively

A noteworthy observation is the significant improvement in formal
error (95% CI) between the R10 (G) (Figure 5) and the R10 (GEC) (Figure
6). Including additional constellations, which increased the median
number of satellites from 8 to 21, clearly enhanced the receiver
computed formal error. Similar improvements were observed when one
additional constellation was added (GE), increasing the median number of
satellites to 14.

Figure 5: Height [blue dots] and horizontal [green dots] positions
for the GPS only constellation, Trimble R10 [G]. The grey line
represents the R10 computed 95% CI (formal) error. The red ”+” are
outlier positions that lie outside the 95% CI for which there are 0.1%
(both vertical and horizontal, totals 16). There was 1 rejected position
being greater than 100 mm error.

Figure 5: Height [blue dots] and horizontal [green dots] positions
for the GPS + Galileo + BDS constellations, Trimble R10 [GEC]. The grey
line represents the R10 computed 95% CI (formal) error. The red ”+” are
outlier positions that lie outside the 95% CI for which there are 0.2%
(vertical, total 11) and 0.4% (Horizontal, total 19). There were no
rejected observations (>100 mm error).
3.2 Ground Sites: 19% – 52% satellite visibility masking
The ground sites included a reference mark (REH), where a receiver
was continuously operating, along with several test marks that
experienced progressively less sky visibility. Figures 7 and 8 show data
from two of these sites, REH and P3. Compared to the roof sites, the
ground sites tracked about half as many satellites. As expected, the
median number of satellites decreased as the obstructions increased
(Table 3).
At the reference site (REH), where obstructions were around 19%, the
vertical and horizontal accuracies were reduced by factors of two and
three, resulting in accuracies of 21 mm and 19 mm, respectively (95%
CI). For the other ground sites, as obstructions increased from 19% to
52%, vertical and horizontal precisions progressively worsened, reaching
unacceptably high errors of approximately 100 mm (95% CI) at the most
obstructed site (P7, with 52% obstructions) (Table 3).
The positioning results (not tabulated) using only the GPS
constellation were even poorer. While these results align with
expectations, the key finding is that even with multi-constellation
solutions, positioning accuracy is significantly impacted by relatively
small increases in obstructions. For example, a 20% obstruction level
reduces accuracy by a factor of two to three.
Table 3: Summary data for the ground sites including the median
number of satellites tracked, obstructions (%), the vertical and
horizontal accuracy as determined by the 95% CI and CEP metrics, the
number of outlier observations greater than the receivers’ formal error
(95% CI).

As expected, there is an increase in outlier positions with
decreasing accuracy. Additionally, the number of rejected positions
(with errors greater than 100 mm) also increases. Table 3 shows the
number of outliers exceeding the 95% confidence interval (CI). For the
roof sites (Section 2.1), the vertical component showed a slight bias
towards negative errors. However, at the ground sites, as obstructions
increased, the majority of the vertical errors are positive. While there
seems to be a decrease in outlier observations at sites P3, P5, and P7,
this is actually due to more instances where the receiver could not
calculate a position because of increased obstructions. As a result, the
total number of positions recorded were fewer, and the errors became
larger.
A key difference between the ground sites REH (Figure 7) and P3
(Figure 8) is the increase in outlier positions, based on the receiver's
computed (formal) error (95% CI). Clearly, the formal error
underestimates the position precision, with outlier observations at REH
being 30% for the vertical compoent and 46% for the horizontalcomponent.
In Figure 7 (REH), the outlier observations are spread across the entire
error distribution, with both small and large errors. There is also a
noticeable north-south bias in the horizontal errors, and a positive
bias in the vertical errors (1099 positive vs. 797 negative). This
suggests that the RTK positioning model is not accounting for either the
reduced number of available satellites (geometry) or the increased
measurement noise from multipath and/or vegetation interference.
In contrast, the results at P3 show an improvement (decrease) in the
number of outliers, with vertical and horizontal outlier observations at
15% and 35%, respectively. However, the receiver's computed 95% CI
formal uncertainity are larger compared to REH, which leads to fewer
outliers being identified. Unlike REH, the positioning model at P3
appears more realistic, and if we assume that the measurement noise (due
to multipath and vegetation) is similar at both sites, the main factor
causing the difference is the number of available satellites. The median
number of satellites tracked decreased from 16 at REH to 12 at P3.
To compare the performance across all five ground sites (P1, P3, P5,
P7, and REH), Figure 9 provides a summary. The figure shows the number
of satellites tracked (top row), vertical coordinate errors (middle
row), and horizontal coordinate errors (bottom row) for each site. The
median bias and root mean square (rms) values for vertical and
horizontal errors are also shown. The degradation in positioning
accuracy is clearly shown for the sites P1 – P7 compared to the
reference site REH.
Finally, Figure 10 shows horizontal plots for the roof site (SD15),
reference site (REH), and the ground sites (P1 – P7). The plots for both
the GPS-only (G) and GPS + Galileo + BDS (GEC) constellations are shown
for SD15 and REH, while only the GEC constellation is shown for the
other sites. The black circle represents the 95% CI uncertainty in the
horizontal component, and both horizontal and vertical uncertainty
values (95% CI) are also included for each site.
The roof site (SD15) performed as expected, with virtually no
obstructions, minimal multipath and no vegetation interference,
resulting in 95% CI horizontal uncertainties of around 10 mm. There were
a small number of outlier positions. When sky masking increased to
around 20%, the 95% CI uncertainty doubled to around 20 mm for the GEC
constellation and 20-30 mm for the GPS-only constellation. For the
remaining ground sites, where sky visibility ranged from 24% (P3) to 52%
(P7), the 95% CI uncertainty increased from 30-40 mm to around 100 mm.

Figure 6: Height [blue dots] and horizontal [green dots] positions
for the GPS + Galileo + BDS constellations, Trimble R10 [GEC]. The grey
line represents the R10 computed 95% CI (formal) error. The red ”+” are
outlier positions that lie outside the 95% CI for which there are 30%
(vertical, total 1736) and 46% (horizontal, total 2748).
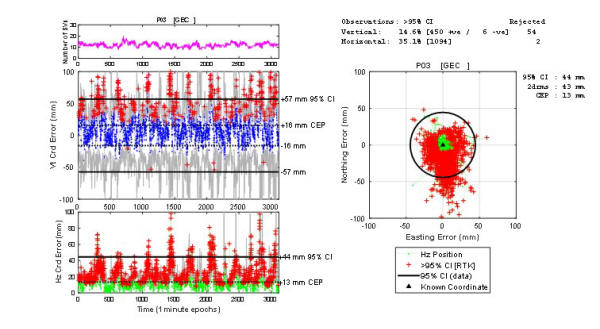
Figure 7: Height [blue dots] and horizontal [green dots] positions
for the GPS + Galileo + BDS constellations, Trimble R10 [GEC]. The grey
line represents the R10 computed 95% CI (formal) error. The red ”+”
are outlier positions that lie outside the 95% CI for which there are
15% (vertical, total 450) and 35% (horizontal, total 1094). There was 54
/ 2 rejected vertical / horizontal positions being greater than 100 mm
error.

Figure 8: Summary plots for the sites P1, P3, P5, P7 and REH. Shown
are the median number of satellites (top row), median coordinate error
and rms for the vertical (middle row) and horizontal (bottom row)
coordinate error.

Figure 9: Plots of horizontal position for the sites reference site
REH (G and GEC constellations); the roof sites SD15 (G and GEC
constellations); and the ground sites P1, P3, P5, P7 (GEC constellations
only), The black circle represents the 95% CI horizontal coordinate
uncertainty, and the 95% CI numerical uncertainties are given for both
the horizontal and vertical coordinate components.
4. SUMMARY
GNSS RTK positioning accuracy is generally assumed to align with the
specifications provided by GNSS manufacturers. For locations with no
obstructions and clear sky visibility, these accuracy levels are easily
achieved. In such conditions, the reported RTK accuracies are
consistent, and a slight improvement is observed when using
multi-constellation solutions (e.g., GPS combined with Galileo (GE) or
GPS, Galileo, and BeiDou (GEC)) compared to GPS-only solutions.
However, even minor obstructions (e.g., 20% blockage) lead to a
significant reduction in accuracy, with errors increasing by a factor of
2–3. This degradation is primarily attributed to three factors: poorer
satellite geometry due to fewer tracked satellites, increased signal
noise caused by multipath effects, and signal interference from
vegetation. While horizontal positioning errors occur in all directions,
there is a slight bias predominantly in the north-south direction. For
the vertical component, the errors tend to show a positive bias.
As the level of satellite obstruction increases (e.g., from 19% to
52%), both vertical and horizontal errors rise rapidly—from
approximately 20–30 mm at 19% obstruction to around 100 mm at 52%
obstruction. Additionally, higher levels of obstruction reduce the
receivers' ability to reliably resolve positions.
REFERENCES:
- Chin, G. Y., (1987). Two-dimensional measures of accuracy in
navigational systems, (No. DOT-TSC-RSPA-87-1). United States. Dept.
of Transportation. Office of Research and Special Programs. URL:
rosap.ntl.bts.gov/view/dot/9683/dot_9683_DS1.pdf. Accessed
November 2024.
- Deakin, R. E. and Kildea, D. G., (1999). A note on standard
deviation and RMS. Australian Surveyor, 44(1), 74-79.
- Greenwalt, C. R., and Shultz, M. E. (1962). Principles of error
theory and cartographic applications, Tech Report No. 96, United
States Air Force, Aeronautical Chart and Information Center. Louis,
MO, USA. URL:
apps.dtic.mil/sti/tr/pdf/AD0276978.pdf. Accessed November 2024
- Taub, A. E. and Thomas, M. A. (1983). Confidence Intervals for
CEP when the errors are elliptical normal. Tech. Rep. No.
NSWC/TR-83-205. Dahlgren, VA: US Naval Surface Weapons Center,
Dahlgren Division. URL:
apps.dtic.mil/sti/tr/pdf/ADA153828.pdf. Accessed November 2024.
- van Diggelen, F., (1998). GNSS Accuracy, Lies, Damn Lies and
Statistics, GPS World, 9(1), 41-45. URL:
www.gpsworld.com/gps-accuracy-lies-damn-lies-and-statistics/,
Accessed November 2024
- van Diggelen, F., (2007). GNSS Accuracy, Lies, Damn Lies and
Statistics, GPS World, 18(1), 26-33. URL:
www.gpsworld.com/gpsgnss-accuracy-lies-damn-lies-and-statistics-1134/,
Accessed November 2024.
BIOGRAPHICAL NOTES
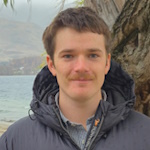
Paul Denys: I have been an academic staff member at the School of
Surveying, Otago University since 1995, teaching papers in Survey
Methods and Survey Mathematics. My primary interest is GNSS positioning
and geodetic data analysis with a focus on RTK positioning errors and
active deformation. New Zealand offers an excellent opportunity to
study and understand the broad scale deformation of the
Australian-Pacific plate boundary as well as focusing on specific
problems: Central Otago and Cascade deformation, Southern Alps uplift
and sea level rise. I have also been involved with the geodetic
analysis of recent major earthquake events in New Zealand and including
the maintenance of the geodetic infrastructure.
CONTACTS
Dr. Paul H. Denys
School of Surveying
University of Otago
PO Box 56
Dunedin
NEW ZEALAND
Web site:
www.otago.ac.nz/surveying


